A drop, then a rebound.
The 12 and 17 June 2014 curves show lower load around the games and recovery afterward. ONS relates changed load patterns to changed routines.
Observed load + operational reportONS · 2014 / 2015A Global Perspectives investigation
This website turns evidence into action.
Two extraordinary events. One complex electricity system. Follow the evidence from the 2014 World Cup to Rio 2016.
Most event data here concern electricity demand/load, which is only one part of national energy use.
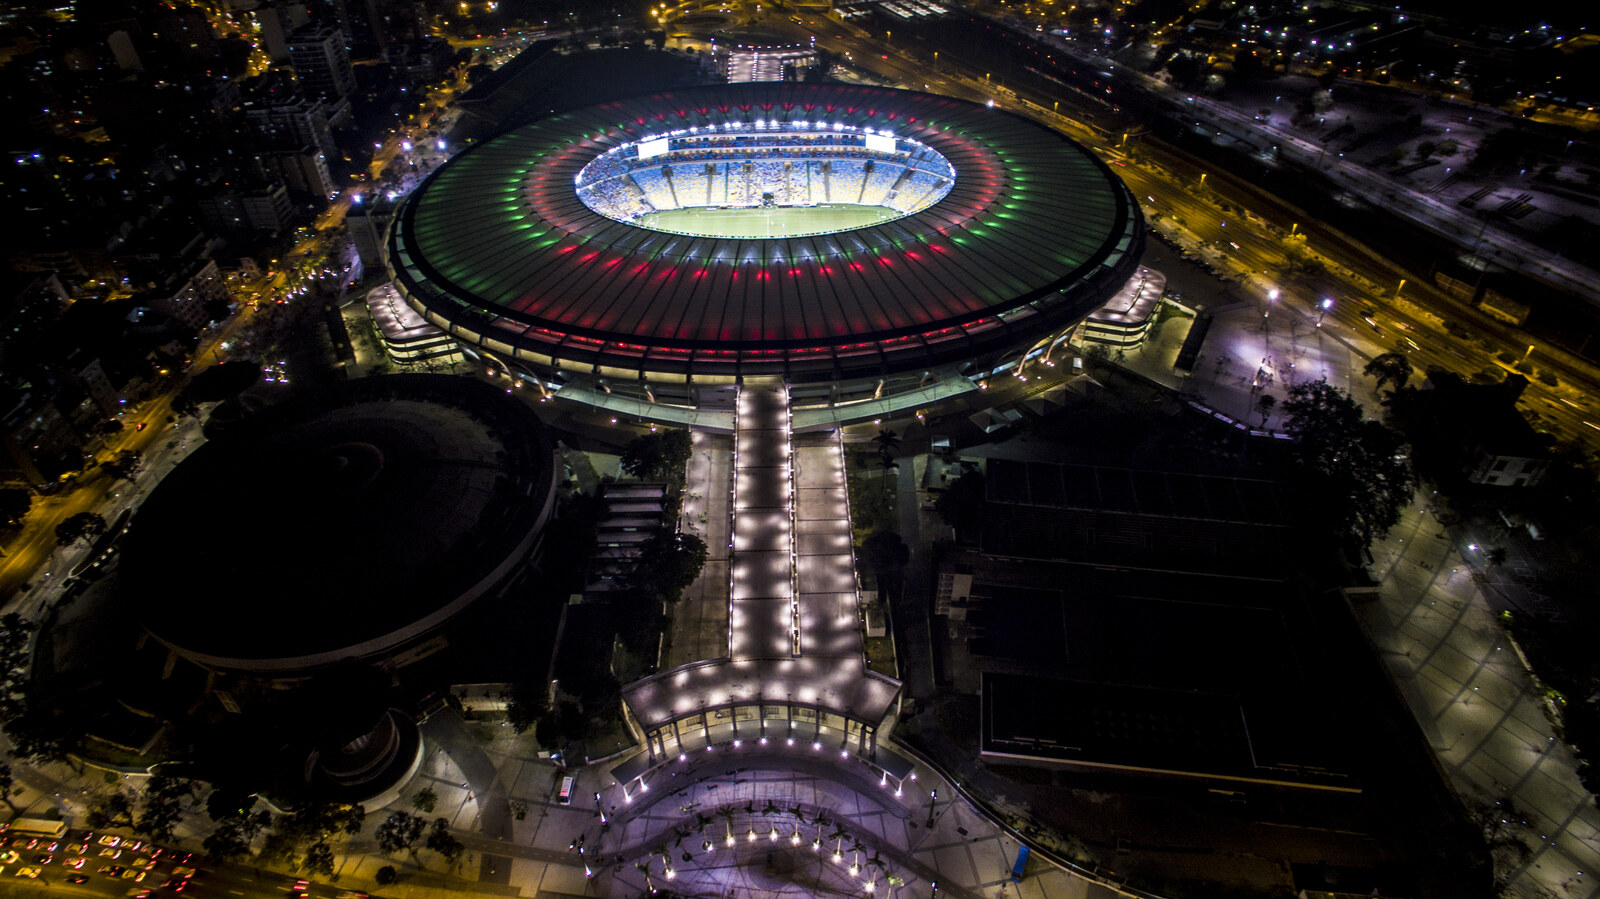
The lights are only
part of the story.
12 June 2014, 17:00 vs 5 June, 17:00. A difference between days, not a measured causal saving.
Operador Nacional do Sistema Elétrico (ONS)U.S. Energy Information Administration (EIA) reported higher city demand on 11 August 2016. No magnitude was given.
U.S. Energy Information Administration (EIA)2016 compared with 2015. The national annual trend is not an estimate of the Olympic Games’ effect.
Empresa de Pesquisa Energética (EPE) · 2017Three different indicators and time scales. Do not compare their magnitudes directly.
Energy in Brazil
Data institutions and units: Operador Nacional do Sistema Elétrico — Brazil’s National System Operator. Coordinates generation and transmission in Brazil’s interconnected electricity system. · Sistema Interligado Nacional — National Interconnected System. The connected Brazilian grid; it does not include every isolated electricity system. · Empresa de Pesquisa Energética — Energy Research Office. Publishes official energy balances and statistics for Brazilian energy planning. · U.S. Energy Information Administration. A United States government agency that publishes energy data and analysis. · Megawatt. A unit of power: 1 MW = 1,000 kW. MWh measures energy over time. GW = 1,000 MW; TWh = 1,000,000 MWh.
The electricity mix describes electricity sources; the broader energy mix also includes transport fuels, industrial heat, cooking and other uses.
These historical supply shares include imports. They describe 2016, not the present-day mix.
Total final consumption includes the interconnected system, isolated systems and self-production. The grid-sector chart uses a narrower boundary; these totals cannot simply be subtracted as “waste”.
EPE · 2017EPE · total final consumption · p. 30Two main case studies
Photographs: Maracanã in 2015 and Olympic Park in May 2016. Credits and licences in Sources. Fédération Internationale de Football Association. The international football governing body and World Cup organizer.
Bonus comparisons
Two smaller comparisons add context.
Explore the evidence
Reference: 5 Jun 2014. Same weekday before the tournament; selected to avoid another World Cup day. Weather, holidays and work schedules are not controlled. The gap is not a causal estimate.
Hourly averages cannot resolve halftime spikes. The match window is approximate; Brazil–Chile includes extra time and penalties. During-window readings describe hours, not an event-only energy total.
Operador Nacional do Sistema Elétrico — Brazil’s National System Operator. Coordinates generation and transmission in Brazil’s interconnected electricity system. · Sistema Interligado Nacional — National Interconnected System. The connected Brazilian grid; it does not include every isolated electricity system. · Megawatt. A unit of power: 1 MW = 1,000 kW. MWh measures energy over time. GW = 1,000 MW; TWh = 1,000,000 MWh.
What actually changed?
The 12 and 17 June 2014 curves show lower load around the games and recovery afterward. ONS relates changed load patterns to changed routines.
Observed load + operational reportONS · 2014 / 2015The energy agency reported higher demand in Rio during the Olympics. It did not quantify separate contributions from hotels, transport or homes.
Qualitative city-level reportSlade Johnson & Kirstin Berndt · 11/08/2016Redundant supply and resilience matter even when aggregate load falls. Additional capacity is not proof of additional electricity consumed.
Documented infrastructureMME · Ministério de Minas e Energia · 28/03/2016Key distinctions
A local result cannot stand for the whole country.
Different geography and different indicators.
Hours and annual totals answer different questions.
A rate of use versus energy accumulated over time.
Energy = average power × elapsed time.
1 MW used for 1 hour equals 1 MWh.
Active power and apparent power are different.
Equipment capability is not a meter reading.
The energy mix includes fuels as well as electricity.
Occurring together does not establish a cause.
From evidence to everyday choices
Illustrative inputs · use your device’s rating
30.0 kWh saved per month
kWh = watts ÷ 1,000 × hours
Monthly estimate = daily kWh × 30
Constant average input power assumed. Devices cycle and vary; cooling capacity is not electrical input power. Values are estimates, not measured savings.
Scale the same action from the calculator.
30.00 kWh per person × 1,000,000 people
Same action, every day, for 30 days, with no extra use elsewhere. A scenario, not a forecast. 1 MWh = 1,000 kWh.
Individual action supports efficiency. Reliable infrastructure, energy access and public policy also matter.
Illustrative avoided use over 30 days. Fixed power assumptions; not survey results.
Power × avoided time explains the difference. Prioritize unnecessary high-power use while preserving essential comfort and hygiene. Light-emitting diode. A lighting technology; wattage is electrical power, while brightness must also be considered.
The wider purpose
Sustainable Development Goal. One of the United Nations’ global development goals. Goal 7 concerns affordable and clean energy. 7. Efficiency connects this research to everyday energy decisions.
United Nations · official Goal 7 targetsPractical action
Project recommendations informed by energy-efficiency goals, operational planning and the calculator’s assumptions.
Our proposed solution
Our main solution is this website: a way to question claims, explore evidence and estimate realistic savings. Education and better decisions can reduce unnecessary waste; they do not replace changes in infrastructure and energy policy.
Try one change in the calculatorOur answer
They can raise demand in a host city while load falls around a match, then rebounds. They also require careful system preparation. The evidence does not establish one causal increase in Brazil’s annual energy consumption.
Major events make unusual demand patterns visible. Understanding these patterns helps us choose realistic ways to avoid waste every day.
See the sources and limitationsSources & methodology
Sum the four ONS subsystems to obtain the interconnected system. All plotted timestamps contain all four values. Divide MW by 1,000 for GW. Rio context averages all hours in each full calendar month.
2014 references are the same weekday before the tournament; each exact date is printed below its chart. The 2019 final uses 30 June, the reference chosen in the ONS bulletin. This does not control weather or activity.
Original ONS timestamps are retained without timezone conversion. Kickoffs are stated in Brasília time (UTC−03:00). Highlighted hourly windows are approximate, with three hours for Brazil–Chile. Hourly means cannot resolve halftime.
The 2017 EPE publications provide one historical snapshot. Annual energy, annual grid electricity, system load and equipment capacity have different boundaries. No chart isolates an event’s causal national energy effect.